Modern cricket has entered a data-driven era. Teams no longer rely solely on traditional statistics like batting average or bowling economy when selecting players. Instead, analysts now use advanced predictive metrics to identify players who are most likely to perform under specific match conditions.
Across tournaments such as the ICC Men’s T20 World Cup and leagues like the Indian Premier League, these metrics help coaches and selectors evaluate players beyond simple box-score numbers.
For Indian cricket fans and analysts, understanding predictive metrics can provide valuable insights into team selection decisions and future performance trends.
Below is a breakdown of the key statistical indicators used in modern cricket analytics.
Expected Runs (xRuns)
Expected Runs—often referred to as xRuns—estimate how many runs a batter should score based on the quality of their shots.
This metric factors in:
- Shot placement
- Ball speed and trajectory
- Field positioning
- Historical outcomes of similar shots
For example, if a batter consistently hits the ball into high-probability scoring zones but gets caught due to exceptional fielding, their expected runs may still be high.
Players such as Suryakumar Yadav often rank highly in expected run models because of their ability to find gaps and manipulate the field.
Selectors use xRuns to identify players whose underlying performance may be stronger than their raw statistics suggest.
Strike Rate Impact
Traditional strike rate measures how quickly a batter scores runs, but modern analytics look deeper by calculating strike rate impact.
This metric compares a player’s scoring speed to the tournament average or league average.
For example:
- A strike rate of 150 in a tournament where the average is 130 represents a strong positive impact.
- A strike rate of 135 in a high-scoring tournament may be considered average.
Aggressive batters such as Yashasvi Jaiswal often produce high strike rate impact numbers, making them valuable in T20 team selection.
Selectors use this metric to identify players who can accelerate scoring during critical match phases.
Boundary Percentage
Boundary percentage measures the proportion of a batter’s runs that come from fours and sixes.
This statistic is particularly important in T20 cricket, where boundaries drive scoring momentum.
Key insights from this metric include:
- Power hitters typically have higher boundary percentages.
- Anchor batters tend to rely more on singles and doubles.
- Teams balance lineups by mixing both profiles.
Explosive players like Hardik Pandya are often selected for their ability to increase boundary frequency in the death overs.
Bowling Expected Wickets (xW)
Similar to expected runs, expected wickets estimate how many wickets a bowler should take based on delivery quality.
This model evaluates factors such as:
- Ball speed and movement
- Line and length consistency
- Batter response probability
A bowler might appear unlucky if catches are dropped or edges fall short of fielders, but their xW numbers can reveal strong underlying performance.
Elite bowlers such as Jasprit Bumrah frequently rank near the top in expected wicket metrics due to their ability to generate high-quality deliveries.
Selectors often use xW to identify bowlers who are likely to improve statistically in upcoming matches.
Dot Ball Percentage
Dot ball percentage measures how frequently a bowler delivers balls that concede zero runs.
This metric is particularly important during:
- Powerplay overs
- Middle overs in T20 cricket
- Pressure situations in run chases
Spinners such as Ravindra Jadeja often excel in this category because of their accuracy and ability to restrict scoring.
A high dot ball percentage can build pressure that eventually leads to wickets.
Selectors often prioritize bowlers with strong dot ball metrics in shorter formats.
Matchup Analytics
Matchup analytics analyze historical performance between specific batters and bowlers.
Teams now examine data such as:
- Strike rate against particular bowling types
- Dismissal frequency against certain deliveries
- Scoring zones for individual batters
For example, if a batter struggles against left-arm wrist spin, selectors may prefer including bowlers who exploit that weakness.
Teams regularly use matchup analysis during major tournaments like the ICC Cricket World Cup and T20 competitions.
Pressure Index
The pressure index evaluates how players perform in high-pressure match situations.
It analyzes performance in contexts such as:
- Tight run chases
- Death overs
- Knockout matches
Players who consistently deliver in pressure situations often become valuable assets in international tournaments.
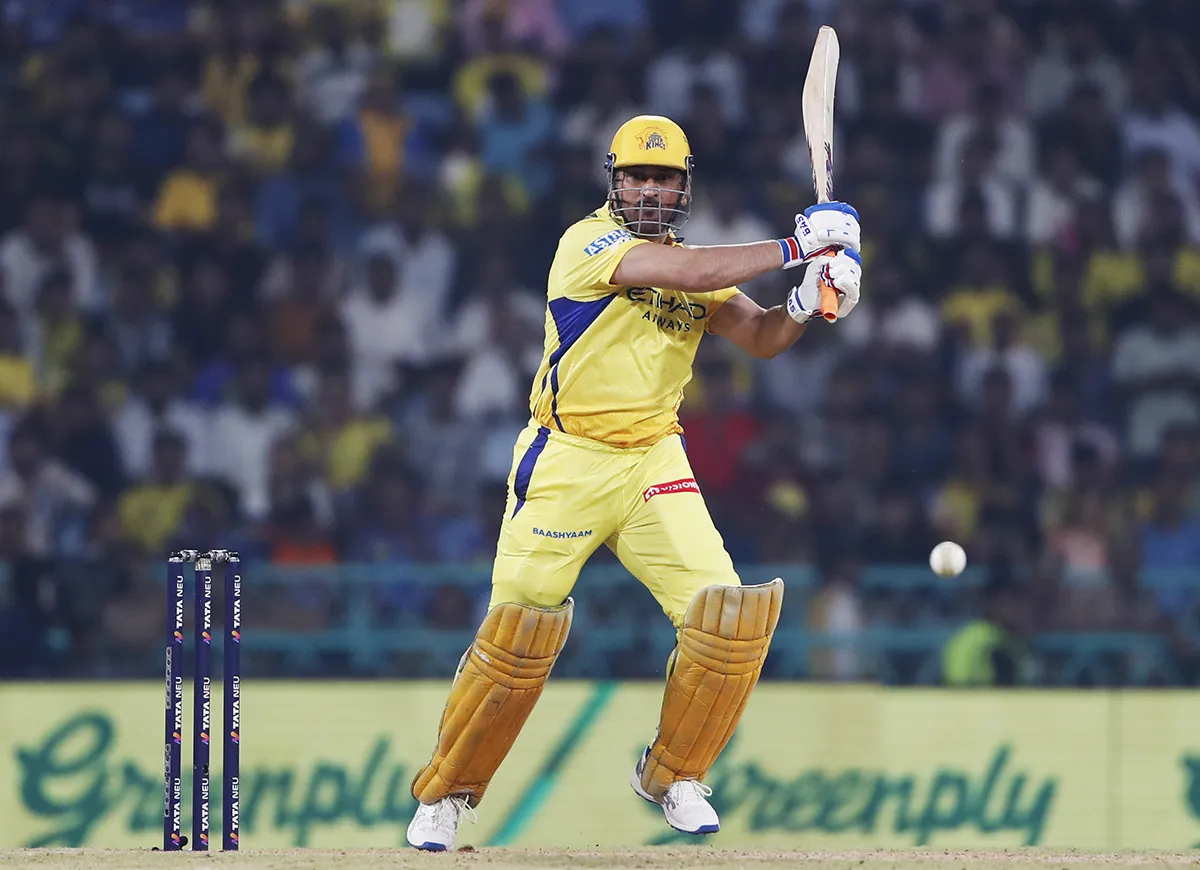
For example, match finishers like MS Dhoni historically ranked highly in pressure-based analytics because of their ability to perform during tense match scenarios.
Selectors increasingly rely on these models to identify dependable players for major tournaments.
Why Predictive Metrics Are Changing Selection Decisions
Traditional cricket statistics remain important, but predictive metrics provide deeper insights into player performance.
Benefits of advanced analytics include:
- Identifying undervalued players
- Forecasting future performance
- Building balanced team combinations
Data scientists and performance analysts now work closely with team management to interpret these statistics and shape selection strategies.
As analytics technology improves, predictive models will likely play an even bigger role in international cricket decision-making.
Stay Ahead with Cricket Analytics and Match Insights
Understanding predictive metrics can give fans and analysts a smarter perspective on team selection and match strategies.
For the latest cricket statistics, betting insights, match previews, and odds updates, visit Sky247 Cricket and stay informed throughout the global cricket season.